portfolio
the entirety of my data visualization career has taken place in industry, and as a result the vast majority of my projects are not public. but with over a decade in the field behind me, enough of my work has had some public exposure that I can collect a small (and admittedly eclectic) sampling of it here.
a cursor steps from one day to the next and hovers over glucose and carbohydrate input elements, showing tooltips with individual values, while the time in range and insulin statistics in the sidebar update for each day.
my implementation of Tidepool's main visualization, bringing blood glucose and insulin pump data together into one unified timeline, has stood the test of time: more than a decade later, it's still in use, and I remain the top contributor to the codebase.
the Trends view summarizes two weeks of glucose readings as box plots by time of day. hovering over a late-evening box highlights intersecting daily glucose traces, including for Monday, September 28. clicking that trace opens the Daily view for that day, where the cursor hovers over the late-evening glucose peak and the 100-gram carb entry logged before it.
we developed the Tidepool Trends view later as a way to combine a large volume of blood glucose data grouped by hour of the day to understand daily patterns. hovering over a section of the trends display brings up the blood glucose traces for the days that pass through that section, and clicking a trace takes the user directly to that day's full timeline. this is extraordinarily helpful for doctors and patients to find and discuss high and low blood glucose excursions after the fact.
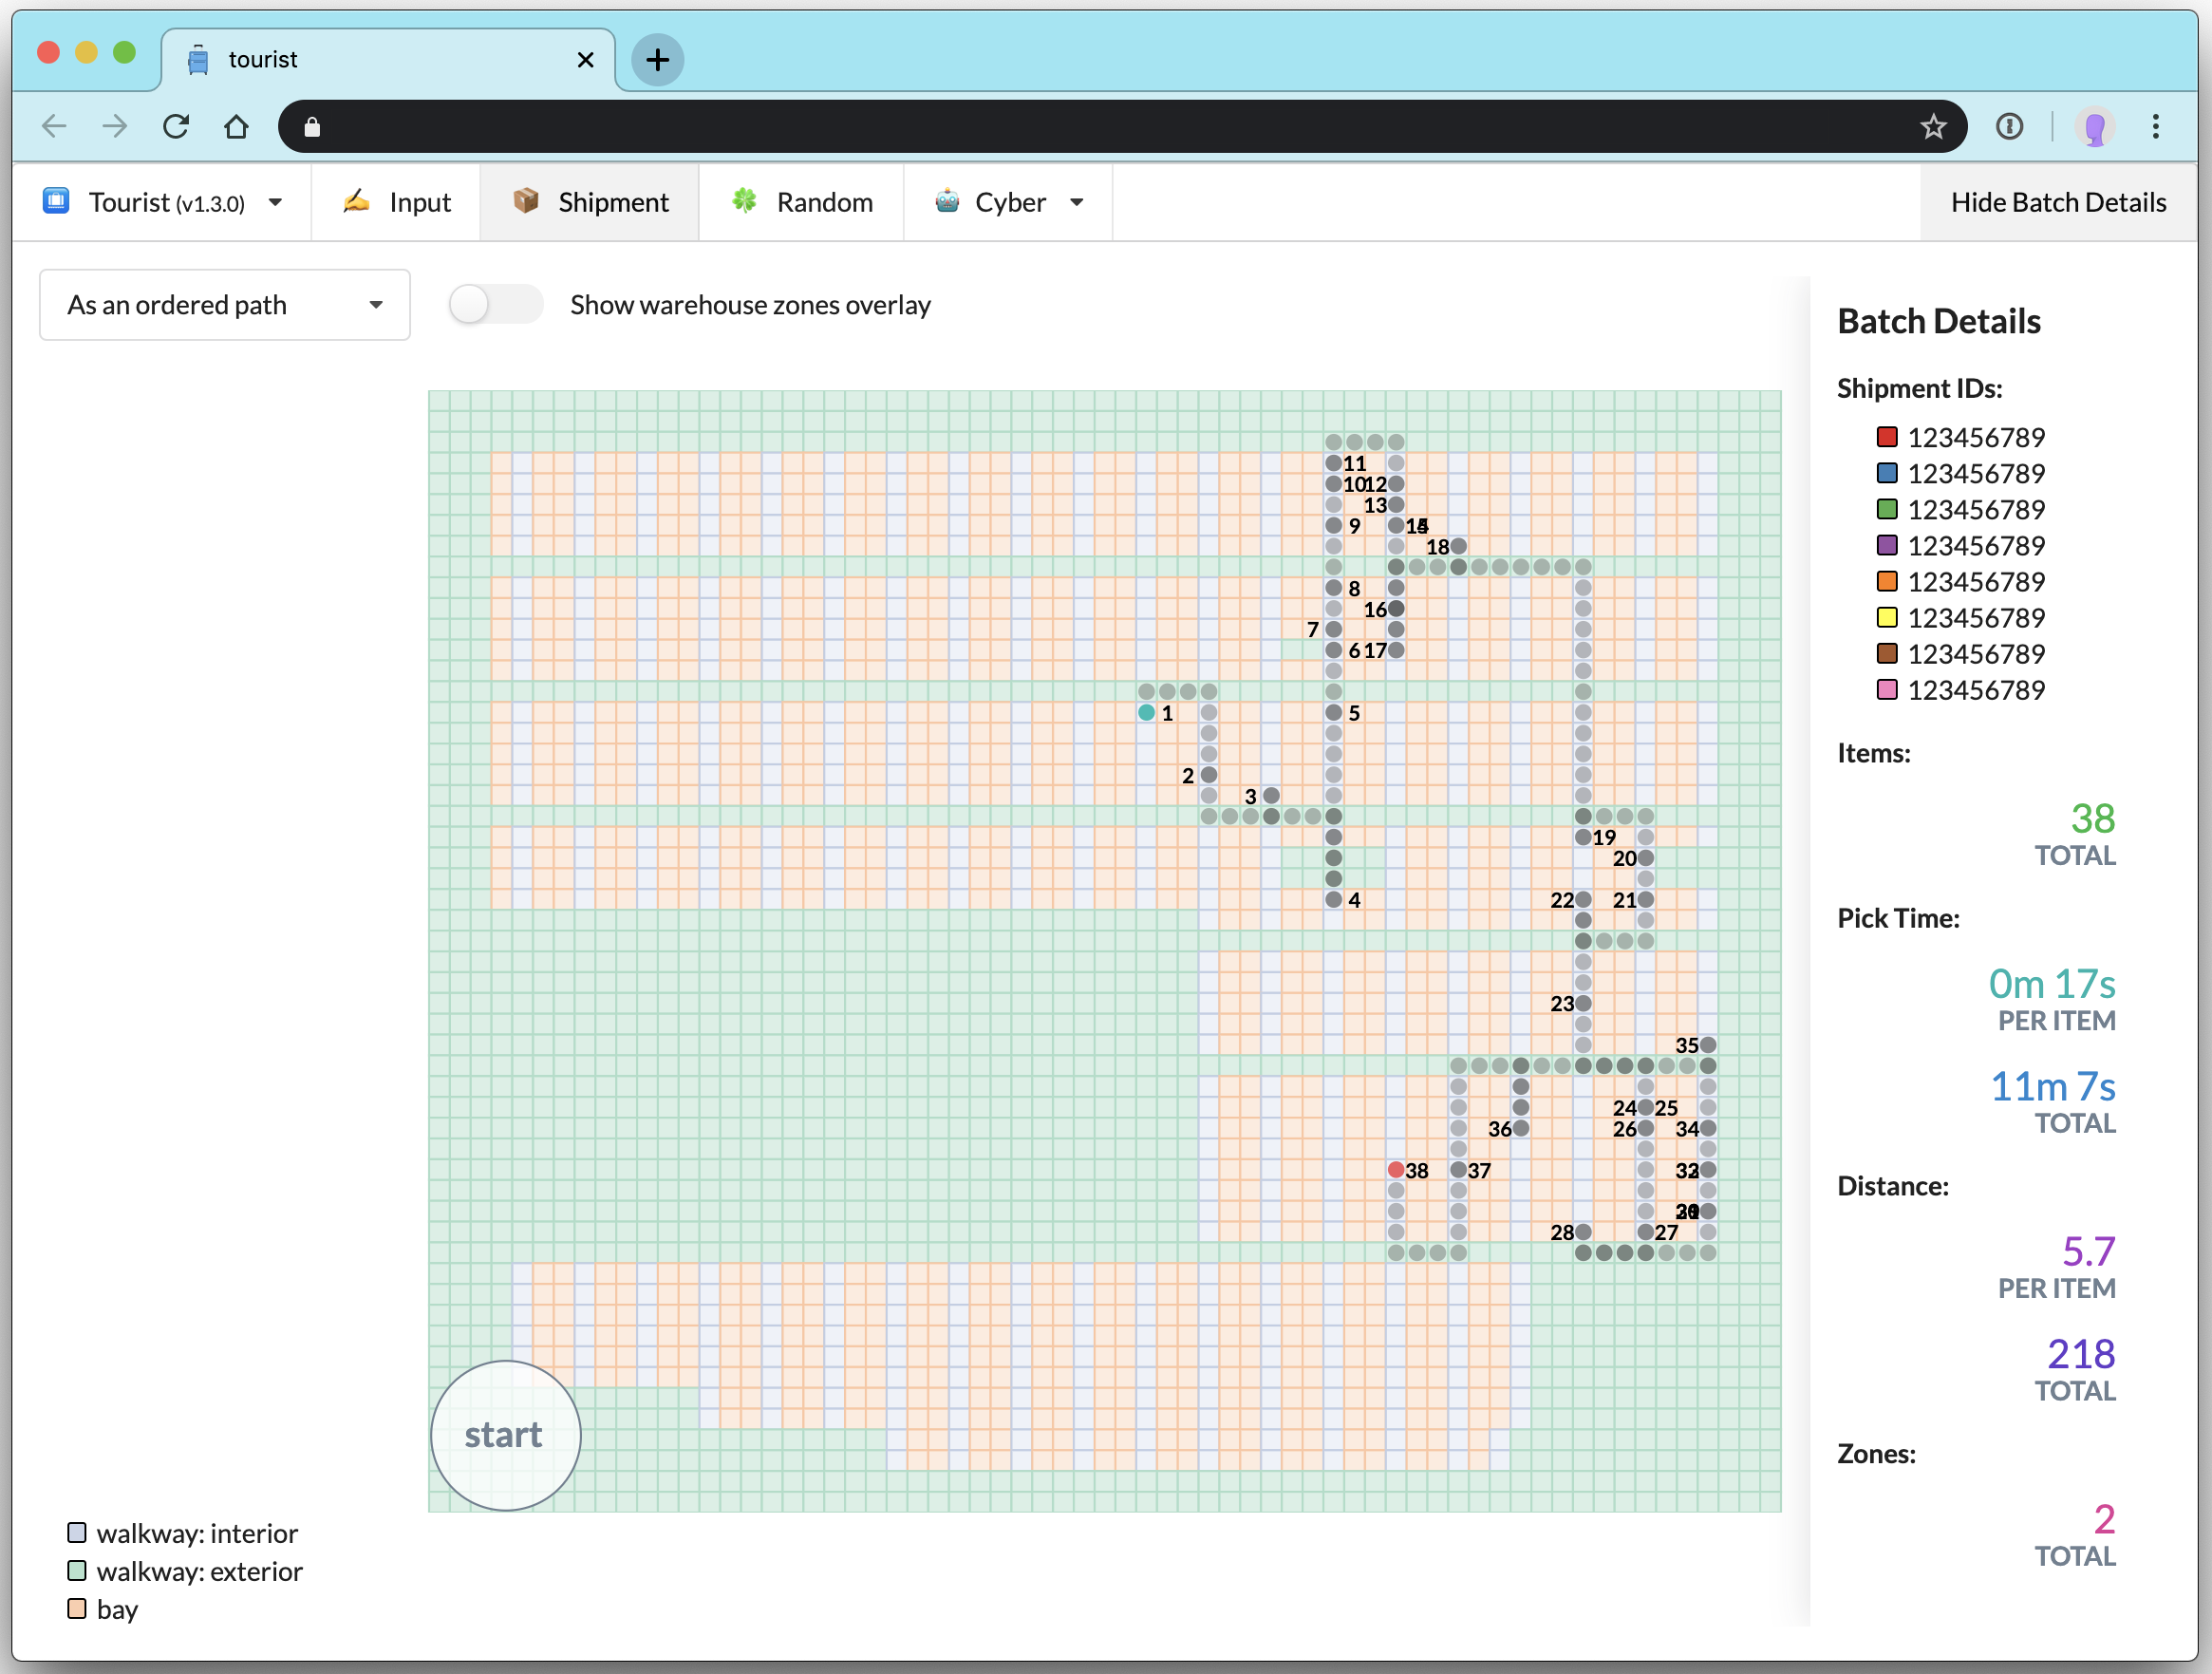
one project I worked on at Stitch Fix was a warehouse pick path debugging tool that we named tourist. you can read about it on Stitch Fix's Multithreaded blog.
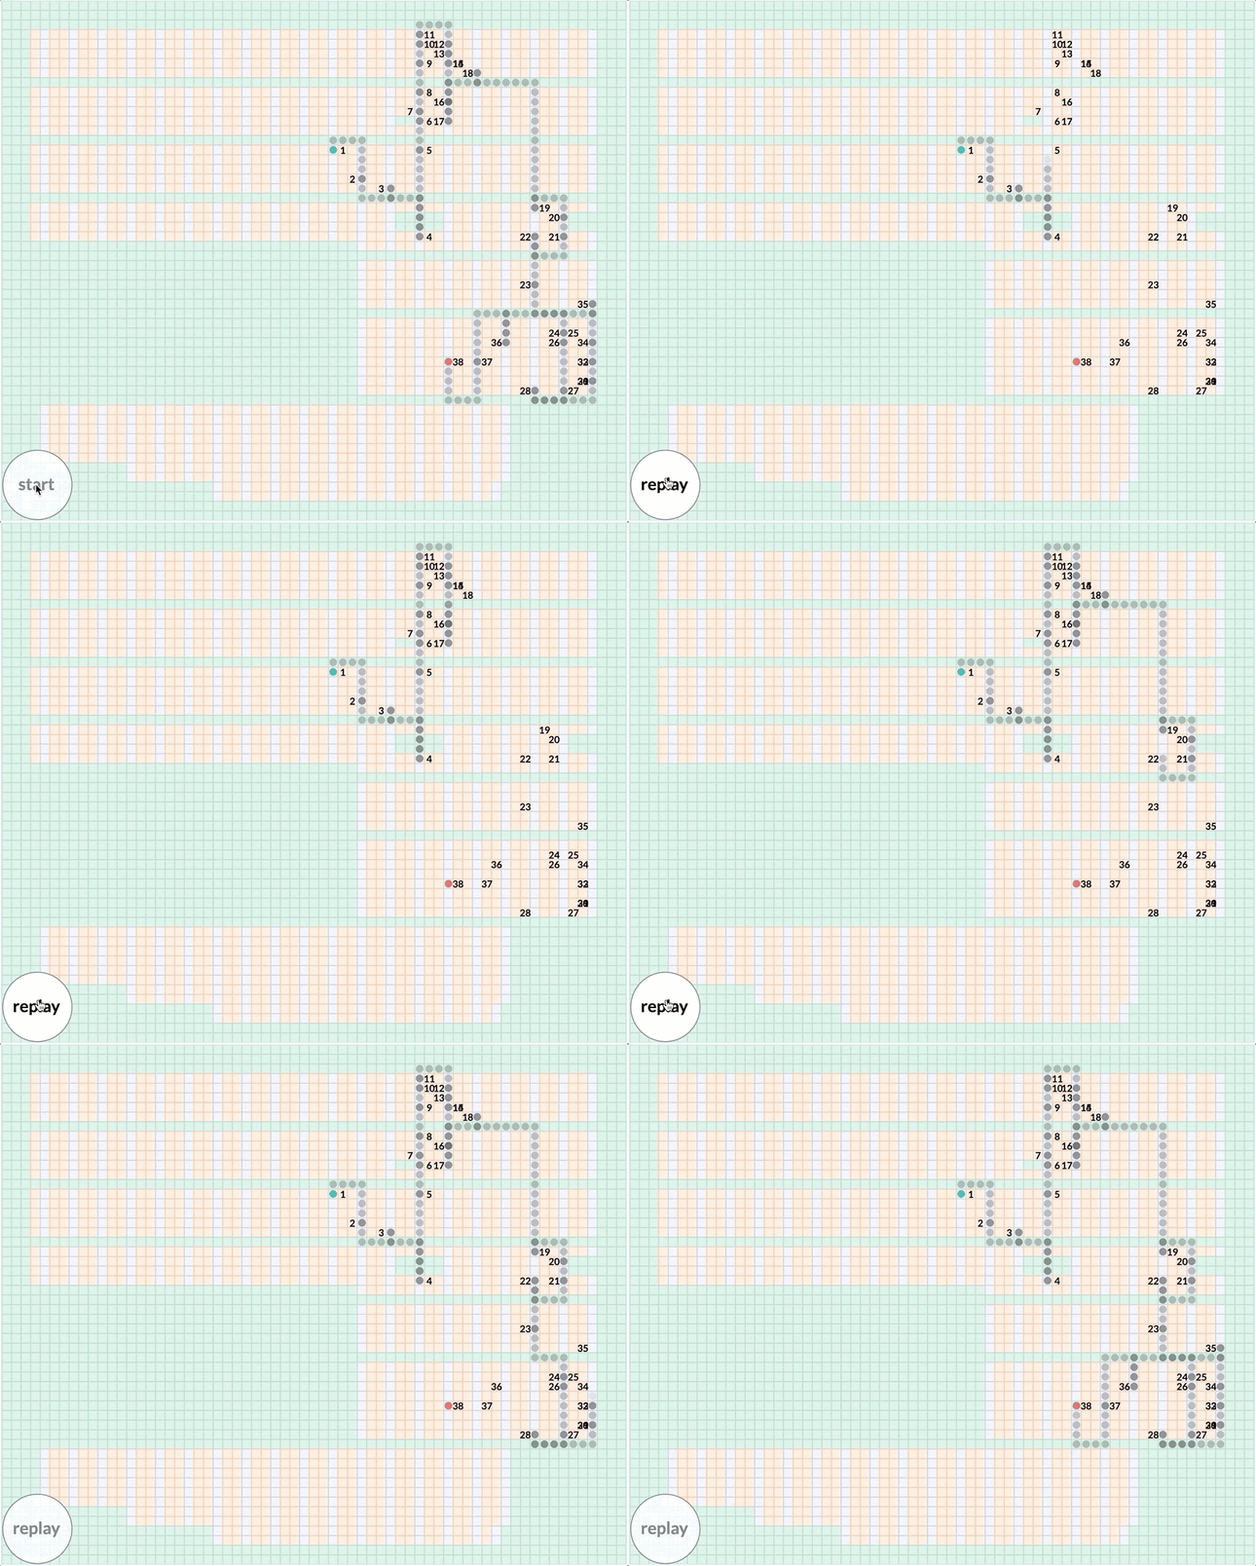
one feature of tourist was an animation of the pick path, an amusingly tricky technical problem given that pick paths were stored as just the order of locations in the warehouse. in order to derive the path itself, I had to implement client-side breadth-first search to find the shortest path between the ordered items on the warehouse map grid.
the animation first builds a ring of 26 color families: 3 primary colors, 3 secondary colors, 12 tertiary colors between them, and 8 clothing-relevant neutrals. it then follows one family, purple, as a tree that branches left to right into common colors such as primary purple, then design colors including Barney, then XKCD color names such as warm purple, ugly purple, and purply.
a minor responsibility of the Algo UI team at Stitch Fix was producing graphics for blog posts on Stitch Fix's Multithreaded tech blog. I produced the explainer graphics for Dan Tasse's post about the color data model used for our clothing merchandise at Stitch Fix.
5,000 handwritten MNIST digits start as a scattered cloud and pull apart into colored clusters, one per digit from 0 to 9, as the iteration count climbs. throughout, someone types into a text box in the corner and the typed text appears instantly, showing the page stays responsive while the computation runs.
as a side project at Stitch Fix and then a conference talk, I explored ways to do dimensionality reduction practically in the browser via an open-source JavaScript implementation of the UMAP algorithm. using one Web Worker for the UMAP computation and another Web Worker with OffscreenCanvas for the live rendering, I was able to iteratively cluster 5K of the MNIST digits at 60+ fps while keeping the browser responsive to text input or other user actions.